Layer Attribute Enrichment

img

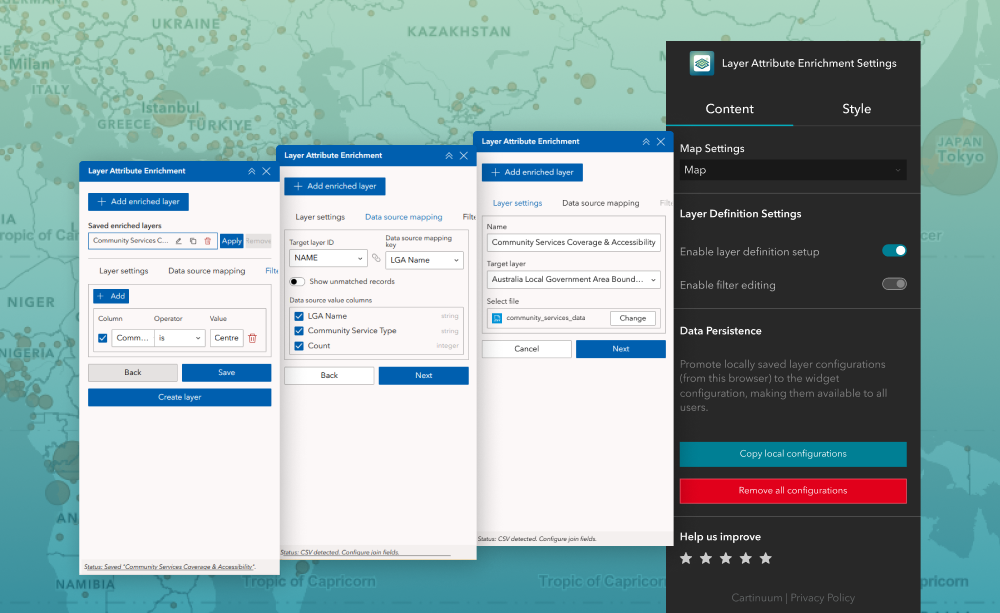
The Layer Attribute Enrichment widget enables users to combine statistical CSV data with existing map layers by performing a configurable attribute join directly inside the app. It creates a new enriched map layer containing selected fields from the CSV, allowing users to filter and explore data—such as years, scenarios, or risk types—spatially on the map.


What it helps you do

  • Bring statistical tables into the map experience, letting users enrich layers with CSV based attributes such as forecasts, scenarios, or risk metrics.
  • Compare multiple scenarios or years by generating enriched layers that reveal spatial differences and trends.
  • Cut manual prep time in half by eliminating offline data joins and allowing analysts to configure everything inside Experience Builder.
  • Control end user freedom, choosing whether they can configure their own joins or only toggle filters on pre defined enriched layers.

Key features

  • CSV to layer attribute joining—Users can select a CSV stored in ArcGIS portal and append chosen fields to a map layer using shared keys.
  • Field level control—App authors or users (depending on mode) choose exactly which fields to append—e.g., Year, Scenario, Risk Type, Values.
  • Two interaction modes
    • Full definition Mode: End users can build custom enriched layers at runtime.
    • Curated Mode: Map authors preconfigure the join and allow end users only to toggle filters (e.g., Year, Scenario).
  • Enriched output layer creation—Produces a new temporary or saved layer containing appended attributes; original layers remain unchanged.
  • Filtering for exploration—Users can filter enriched fields such as Year, Risk Type, or Scenario; and immediately see which geographic features meet selected conditions.

Example use cases

  • Scenario modeling: Attach multi year or multi scenario forecast tables to administrative boundaries to visualize changes over time.
  • Risk assessment: Enrich regions with risk index tables and filter by risk type to identify priority areas.
  • Statistical dashboards: Add demographic or economic metrics from CSV datasets to visualize and filter trends across districts.
  • Asset prioritization: Join inspection or performance metrics to infrastructure layers to support decision making based on enriched attributes.

Using ArcGIS Online?

If you don’t have access to ArcGIS® Experience Builder Developer Edition, try our Hosted Experience Builder environment. It’s the fastest way to start using custom widgets like this one – no local setup or deployment required.

Learn more

USD $149.00 / year
Tax not included
Released on:
2 March 2026
Version:
1.0
Compatibility:
ArcGIS Enterprise v11.5, ArcGIS Experience Builder v1.19